QC lab - vědomostní databáze
Zde najdete vše potřebné o HPLC a UHPLC, návody k obsluze a rutinním operacím

Vychytávky spojené s UV detekcí
Základní princip kapalinové chromatografie:
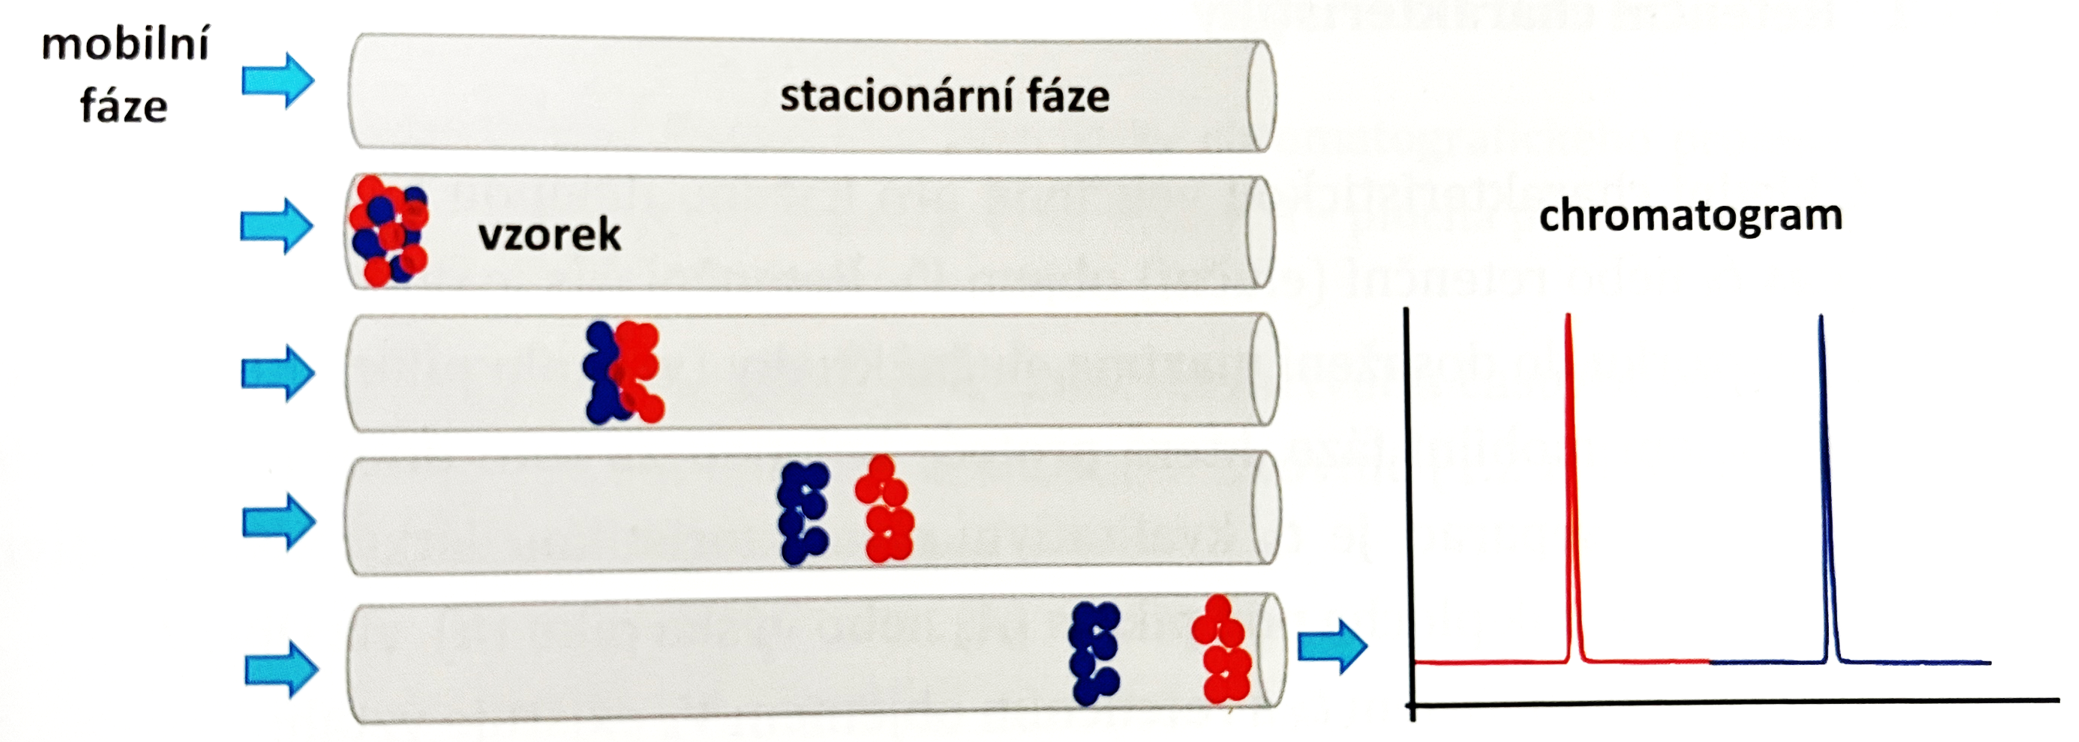
Kapalinová chromatografie je separační metoda založená na rozdílné distribuci dělených látek v roztoku vzorku mezi mobilní a stacionární fází. Stacionární fáze je umístěna v chromatografické koloně ve formě sorbentu. Nejčastějším uspořádáním kapalinové chromatografie je vysokoúčinná kapalinová chromatografie označovaná zkratkou HPLC. Na obrázku výše vidíte separaci dvou látek na koloně a jejich záznam z detektoru - chromatogram. Zkratka UPLC nebo UHPLC označuje systém, který pracuje za vyšších tlaků než klasické HPLC.

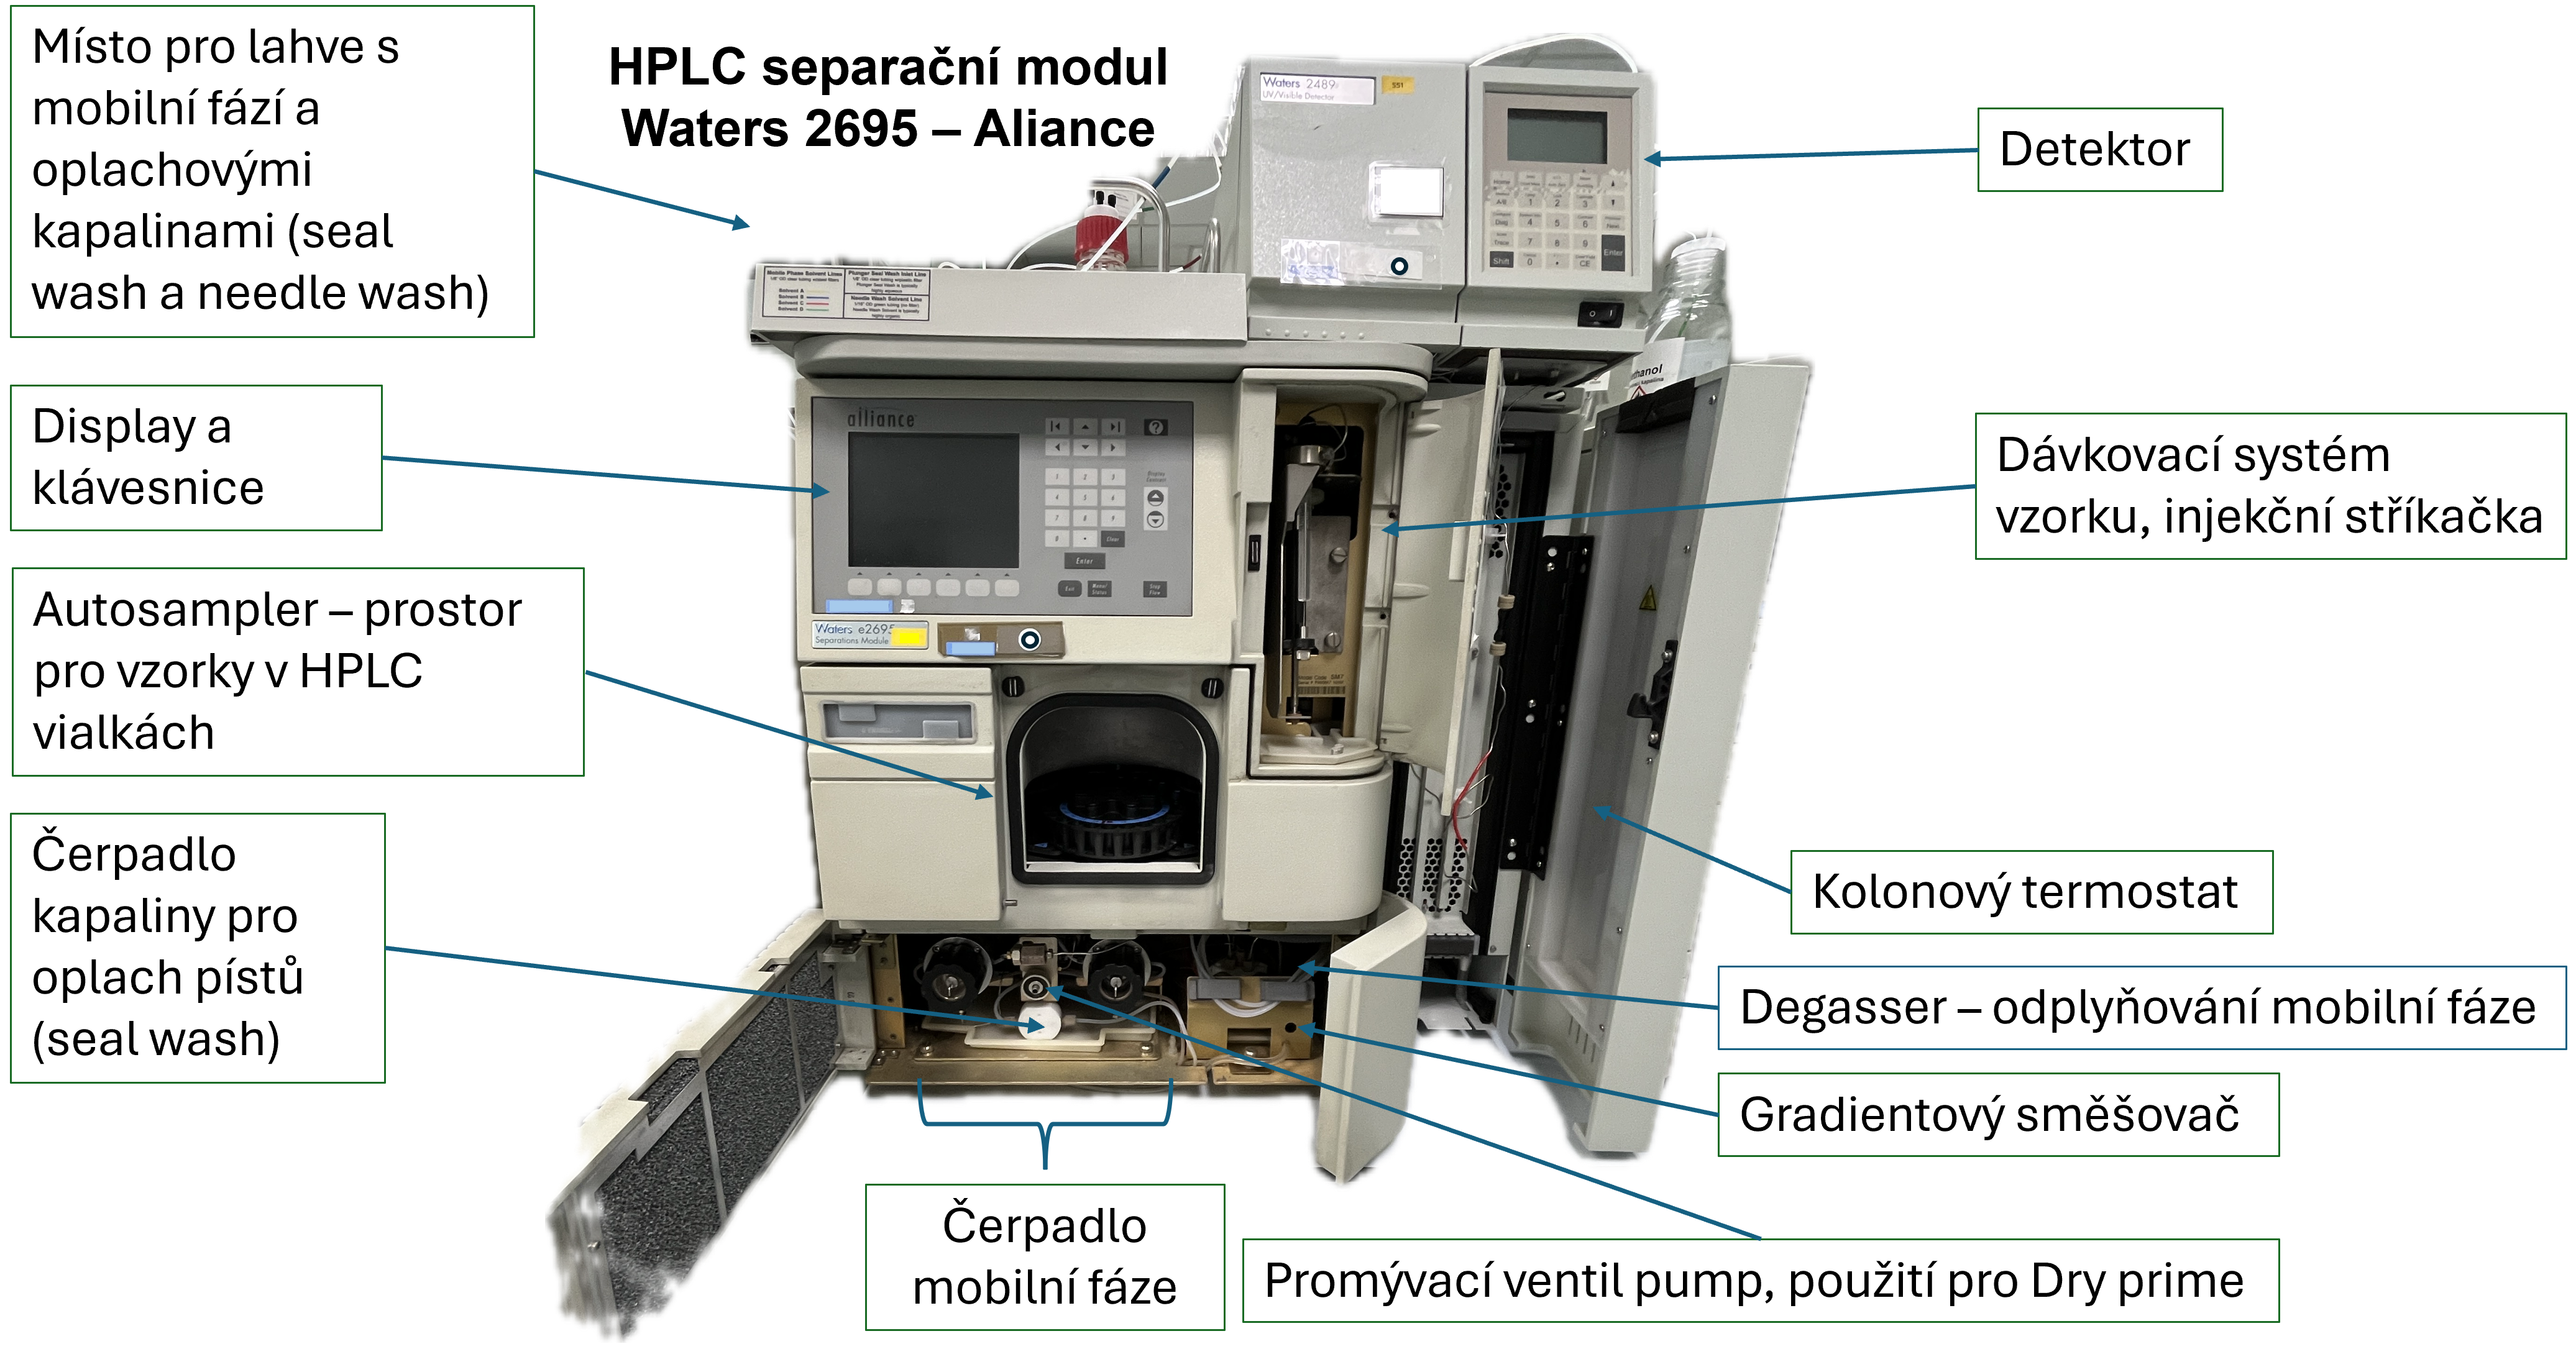
Detektory používané v HPLC:
1. UV/Vis detektory
2. Detektory fotodiodového pole (PDA nebo DAD)
3. Fluorescenční detektory (FLD)
4. Detektory indexu lomu (RI)
5. Detektory rozptylu světla (ELSD)
6. Detektory nabitého aerosolu (CAD)
7. Hmotnostní spektrometrické detektory (MS)
8. Vodivostní detektory (MS)
9. Elektrochemické detektory (ECD)
Mísitelnost organických rozpouštědel používaných v HPLC
| Rozpouštědlo ↓ \\ Rozpouštědlo → | Aceton | Acetonitril | n-Butanol | Chloroform | Cyklohexan | Dichlormethan | DMF | DMSO | Ethanol | Hexan | Propan-2-ol | Methanol | THF | Voda |
|---|---|---|---|---|---|---|---|---|---|---|---|---|---|---|
| Aceton | ✔ | ✔ | ✔ | ✔ | ✔ | ✔ | ✔ | ✔ | ✔ | ✔ | ✔ | ✔ | ✔ | ✔ |
| Acetonitril | ✔ | ✔ | ✔ | ✔ | ✖ | ✔ | ✔ | ✔ | ✔ | ✖ | ✔ | ✔ | ✔ | ✔ |
| n-Butanol | ✔ | ✔ | ✔ | ✔ | ✔ | ✔ | ✔ | ✔ | ✔ | ✔ | ✔ | ✔ | ✔ | ✖ |
| Chloroform | ✔ | ✔ | ✔ | ✔ | ✔ | ✔ | ✔ | ✔ | ✔ | ✔ | ✔ | ✔ | ✔ | ✖ |
| Cyklohexan | ✔ | ✖ | ✔ | ✔ | ✔ | ✔ | ✖ | ✖ | ✔ | ✔ | ✔ | ✖ | ✔ | ✖ |
| Dichlormethan | ✔ | ✔ | ✔ | ✔ | ✔ | ✔ | ✔ | ✔ | ✔ | ✔ | ✔ | ✔ | ✔ | ✖ |
| DMF | ✔ | ✔ | ✔ | ✔ | ✖ | ✔ | ✔ | ✔ | ✔ | ✖ | ✔ | ✔ | ✔ | ✔ |
| DMSO | ✔ | ✔ | ✔ | ✔ | ✖ | ✔ | ✔ | ✔ | ✔ | ✖ | ✔ | ✔ | ✔ | ✔ |
| Ethanol | ✔ | ✔ | ✔ | ✔ | ✔ | ✔ | ✔ | ✔ | ✔ | ✔ | ✔ | ✔ | ✔ | ✔ |
| Hexan | ✔ | ✖ | ✔ | ✔ | ✔ | ✔ | ✖ | ✖ | ✔ | ✔ | ✔ | ✖ | ✔ | ✖ |
| Propan-2-ol | ✔ | ✔ | ✔ | ✔ | ✔ | ✔ | ✔ | ✔ | ✔ | ✔ | ✔ | ✔ | ✔ | ✔ |
| Methanol | ✔ | ✔ | ✔ | ✔ | ✖ | ✔ | ✔ | ✔ | ✔ | ✖ | ✔ | ✔ | ✔ | ✔ |
| THF | ✔ | ✔ | ✔ | ✔ | ✔ | ✔ | ✔ | ✔ | ✔ | ✔ | ✔ | ✔ | ✔ | ✔ |
| Voda | ✔ | ✔ | ✖ | ✖ | ✖ | ✖ | ✔ | ✔ | ✔ | ✖ | ✔ | ✔ | ✔ | ✔ |
✔ - mísitelné
✖ - nemísitelné
DMF - N,N-Dimethylformamid
DMSO - Dimethylsulfoxid
THF - Tetrahydrofuran
The development and optimization of chromatographic methods and the selection of chromatographic conditions usually follow after the analyst has clearly defined which compounds need to be separated and detected. Determining these factors usually takes only a few minutes. However, acquiring knowledge of theoretical principles can save a lot of work and time. Optimizing the method always requires a number of experiments. Therefore, thorough experimental work plays a significant role in method development. In many cases, this is almost exclusively an experimental process.
When developing a method, a literature search of the analytical procedures used for similar analytes is usually carried out first. Valuable information can also be obtained from the properties of the analytes. Optimization of HPLC methods is typically performed with the use of computer programs. During the development of a method, the following steps are usually carried out, and their order may change depending on the type of analysis. This process may involve connecting these individual steps:
- 1. Analysis of the physical–chemical properties of the sample and defining the objective of the method
- 2. Selection of the detection technique for analytes
- 3. Selection of the separation mode
- 4. Selection of the stationary phase
- 5. Preliminary experiments using standard substances
- 6. Selection of the method for sample preparation and sample treatment
- 7. Own method optimization
- 8. Method validation
1. Analysis of the physical–chemical properties of the sample and defining the objective of the method
For the purposes of HPLC method optimization, the following information is important:
• structure of the substance, functional groups
• polarity of chemical individuals (value of log P)
• molecular weight of chemical individuals (Mr)
• solubility of the sample in various solvents
• acid–base properties (values of pKa)
• physical constants (volatility, absorption maxima, redox potentials, etc.)
• stability of the analyte
It is also important to define in advance the objective of the developed method. The approach to HPLC method development may differ significantly depending on the required sensitivity, analysis speed, or the type of matrix in which the analytes are to be determined. In general, the analyst may base the development on the following criteria:
• Will it be possible to separate and detect the substance using an HPLC method?
• Is the method intended for identification, or for quantification of substances?
• What are the expected concentrations of the analyte(s)?
• In what matrix will the analyte(s) be determined?
• How fast should the analysis be?
• What peak resolution is required in the mixture?
• Are standards available for quantitative evaluation?
• Does the available instrumentation allow meeting the answers above?
• What costs will the chosen technique incur?
2. Selection of the detection technique for analytes
Universal detectors:
RI - Refractive Index detector
ELSD - Evaporative Light Scattering detector
CAD - Charged Aerosol Detection
MS - Mass spectrometry detector
Selective detectors:
UV-VIS detector
Conductivity detector
Fluorescence (FL) detector
Electrochemical (ECD) detector
3. Selection of the separation mode
Selecting a chromatographic system that meets the requirements for separating all components of a sample is a relatively complex task. When choosing a chromatographic system, it is necessary to consider:
• the physico‑chemical properties of the sample (differences in structure and properties of individual chemical species)
• availability of chromatographic columns, detectors and experimental methods
• experience with the given technique
• the objective of the work (quantity/quality)
The choice of chromatographic system may be guided by company application databases, pharmacopoeias, scientific publications or other methodological sources. A similar problem may also be approached based on similarity with a problem previously solved. For a completely initial selection of a chromatographic system, it is possible to use categorization according to the basic chemical properties of the analyte, such as molecular weight, solubility and analyte polarity
Analytes can be further divided into several categories characterized by specific physico‑chemical properties such as low‑molecular‑weight compounds, sugars, inorganic ions, polymers, peptides, proteins, nucleic acids and lipids. Owing to the typical properties of these individual groups, it is possible to use specific stationary phases and HPLC techniques for their analysis.

4. Selection of the stationary phase
The selection of the stationary and mobile phases is closely related to the choice of the separation mode, and these two points often overlap. However, there are several aspects that must always be considered when making a decision. Previous experience and information from the literature are important. When optimizing a method that is a completely new application, it is also possible to rely on standard conditions or so‑called “method scouting” for a given chromatographic mode.
For initial screening during method development, gradient methods are particularly suitable, as they allow the analyst to easily get an idea of whether the analyte will be weakly or strongly retained in the given system. They also ensure faster elution of very strongly retained compounds compared to isocratic elution.
When selecting a stationary phase for chromatographic analysis, it is necessary to thoroughly consider aspects of stability and the suitability of the sorbent for the intended purpose. One should ask the following questions:
What will be the expected pH of the mobile phase?
What will be the expected separation temperature?
What separation efficiency and speed are required?
What maximum pressure does the instrumentation allow? (HPLC vs UHPLC)
For most applications, a silica-based stationary phase modified on the surface is the starting choice. However, if higher stability (both chemical and thermal) is required, more stable sorbents must be selected, such as hybrid, polymeric, porous graphitic carbon, or zirconium oxide. These sorbents are also more suitable for method optimization of problematic analytes, as they allow greater flexibility in choosing chromatographic conditions:
Reversed Phases:
neutral → C18 → ACN or MeOH + water
acidic → C18 → water–organic mixture with acidic pH
basic → C18 → water–organic mixture with basic pH
Normal Phases:
neutral → silica gel → hexane–ethanol/propan-2-ol
acidic → silica gel → hexane–ethanol + TFA
basic → silica gel → hexane–ethanol + DEA
HILIC
acidic, neutral → silica gel → ACN–water mixture (80:20)
basic → amide phase → ACN–water mixture (80:20) - acidified
Ion-Exchange
weak acids → SAX → pH > 7
weak bases → SCX → pH < 8
strong acids → WAX → pH < 8
strong bases → WCX → pH > 7
HIC
→ C4 or C8 / sepharose → 1–2 M ammonium sulfate or 3 M NaCl
Chiral separation (NP)
neutral → hexane–ethanol 9:1
acidic → hexane–ethanol 9:1 + TFA
basic → hexane–ethanol 9:1 + DEA
Column dimensions are chosen with respect to the type of chromatographic application, separation difficulty, required analysis speed, and available sample amount for chromatographic analysis. Column dimensions (column length l and internal diameter d₁) influence resolution (column length l), peak width (column length l and internal column diameter d₁), analysis time (column length l), quantification accuracy (column length l and internal diameter d₁), pressure drop across the column (column length l and internal diameter d₁), and the flow rate of the mobile phase (internal column diameter d₁). See Table below.
Typical chromatographic column dimensions and recommended flow rates:
| Column type | Internal diameter [mm] | Recommended flow rate [mL/min] |
|---|---|---|
| Preparative, semipreparative | 9.4 – 5.0 | 6 – 20 |
| Analytical | 4.6 – 3.0 | 0.8 – 2.0 |
| Narrow-bore | 3.0 – 2.0 | 0.05 |
| Microbore | 1.0 – 0.5 | 0.01 – 0.02 |
| Capillary | 0.075 – 0.1 | 0.0001 – 0.00005 |
| Nano | — | — |
5. Preliminary experiments using standard substances
The general optimization procedure involves choosing working conditions that lead to the best possible outcome. The goal of optimization can vary. It can be achieving the best separation (resolution) of all components, optimal separation of selected components, or achieving the highest sensitivity. Often, the shortest possible analysis time is also required. When solving a separation problem, optimization includes the composition of a two- to four-component mobile phase system, gradient profile of the mobile phase, flow rate of the mobile phase, mobile phase pH, and temperature.
The simplest and most common optimization method is the unsystematic trial‑and‑error approach, where separation conditions are gradually changed until the required results are achieved. Another method uses literature information and subsequent empirical adjustments to the analytical method. This method relies on various simple mathematical procedures, but achieving the desired separation may take a long time, and these conditions may not be entirely optimal. If the choice of stationary phase is unambiguous, the greatest effect is usually achieved by optimizing the mobile phase composition, both under isocratic conditions as well as when using binary and ternary mobile phases. Progress in method development for complex mixtures has been achieved through chromatographic optimization software, which works primarily on the basis of calculations to determine optimal conditions such as mobile phase composition, gradient type, pH, temperature, or various combinations of these factors. The first step when selecting the correct stationary and mobile phases still remains based on experimental solutions.
A purely experimental approach is a systematic method development strategy, which allows an automated selection of conditions for the fastest possible efficient separation of various mixtures of compounds. An important advantage is that this method can be fully automated if needed.
To implement automated systematic development, a column thermostat is used, allowing connection of multiple analytical columns (typically 4), and enabling automatic switching between these columns via valves. Input variables selected by the operator include four types of stationary phases (for reversed‑phase separations usually methanol and acetonitrile as organic modifiers) and two buffers (typically acidic and basic pH, due to analyte separation possibilities and stability of tested stationary phases).
6. Selection of the method for sample preparation and sample treatment
This chapter is described in more details in different section of this web, use the link above.
7. Own method optimization
The goal of actual method optimization is to meet all previously defined requirements for the method, i.e., to achieve the required separation of all compounds in the mixture and to reach a sufficient detection limit. The separation of compounds can be influenced in essentially two ways: either by affecting the chromatographic system in a manner that changes the strength of interaction between the analyte and the sorbent — the thermodynamic aspect, or by affecting a factor that influences the efficiency of the chromatographic system — the kinetic aspect. However, it cannot be unambiguously determined whether only thermodynamics or the kinetics of the chromatographic process will change, because altering one parameter may result in changes in both thermodynamics and kinetics. The development and optimization of a chromatographic method is always carried out such that the required resolution achieved preferably in the shortest possible time for the separation of the analytes, and with the lowest possible pressure drop across the column, considering the chosen detection method.
Strongly polar and ionic compounds in reversed-phase systems are retained very little or not at all and are therefore eluted in the void volume of the column no later than the volume corresponding to the column void. This phenomenon is referred to as ion exclusion. The chromatographic behavior of compounds that undergo dissociation can be influenced by choosing the mobile phase pH, because pH changes suppress dissociation of weak acids (pH < 7) or weak bases (pH > 7). Suppressing dissociation results in increased retention and reduced peak tailing of chromatographed compounds. In organic acids, dissociation can be suppressed by lowering pH to about 2–5. In organic bases, dissociation is suppressed by increasing pH to about 8–10. A practical limitation is the risk of dissolving silica gel at pH > 7–8.5. The selectivity of carboxylic acid separations in reversed-phase systems depends on the mobile phase used (its pH) and on the stationary phase.
Gradient elution is the most commonly used and most effective technique for modifying selectivity on a chosen analytical column. Most often, gradient elution is used in reversed‑phase systems, but it is also applied in HILIC, HIC, and other systems. In gradient elution, the mobile phase composition is continuously changed during separation. During the gradient time, the elution strength of the mobile phase increases. Binary (two‑component) mobile phases are most often used, where one mobile phase component has a significantly higher elution strength than the other. The time course of the mobile phase composition is referred to as the gradient profile. The gradient may be linear (straight), convex, concave, or stepwise.
8. Method validation
This part presents an example of a recommended procedure for the validation of pharmaceutical methods. Although validation procedures for methods used in environmental analysis, bioanalytical studies, food analysis, etc., may differ in certain details, the general principles remain the same. The most problematic area during the validation of analytical methods is the correct setting of acceptance criteria for the individual parameters of the validated method. Acceptance criteria clearly define which values each parameter must reach during validation tests. Acceptance criteria related to validation serve as the basis for planning test types and how they will be performed. Acceptance criteria arise from the required quality of the method and must be properly defined.
Accuracy of the Method
Accuracy of the method is defined as the closeness of agreement between the result of a measurement and an accepted reference value. The difference between the accepted reference value and the result obtained by measurement is called the error of the result. The component of the error that remains constant throughout repeated measurements, or changes in a predictable manner (proportional error), is called systematic error of the result. In contrast, the error component that changes unpredictably during repeated measurements is called random error of the result. Random error cannot be eliminated. The difference between the mean value of measurement results (usually expressed as the mean) and the accepted reference value is called the bias. Bias characterizes systematic error and may have positive or negative values.
Precision of the Method
Precision of the method is defined as the degree of agreement between mutually independent test results obtained under specified conditions. Precision depends only on the distribution of random error and is not related to reference values. Independent test results are results obtained without being influenced by any preceding result obtained on the same or a similar test sample. The degree of precision is expressed (calculated) as the relative standard deviation of test results. Precision may be expressed as:
repeatability
intermediate precision
reproducibility
Repeatability is defined as the closeness of agreement between mutually independent test results obtained under repeatability conditions (conditions where test results are obtained using the same measurement method, identical materials, in the same laboratory, by the same operator, using the same equipment, over a short time interval). Intermediate precision refers to precision measured under intermediate precision conditions. These conditions include the same measurement method, but possible variations in parameters such as laboratory, operator, equipment, or time. Reproducibility expresses the closeness of agreement between mutually independent test results obtained under reproducibility conditions, i.e., results obtained using the same analyte in samples of the same material, but under different conditions (different laboratory, equipment, location, conditions, time, etc.). Reproducibility is assessed through interlaboratory comparative studies. During validation, to obtain information about method precision, six independently prepared samples are usually analyzed according to the method, including sample preparation. This provides information on intra‑day precision, representing the precision of the procedure at a given time, on the given instrument, and by a specific operator. If RSD is determined at several concentration levels, a sufficient number is n=3, and RSD is determined separately for each level. If RSD values do not depend on concentration, an overall RSD across all concentration levels is calculated.